Update
Progress Update After 15+ Successful Tests
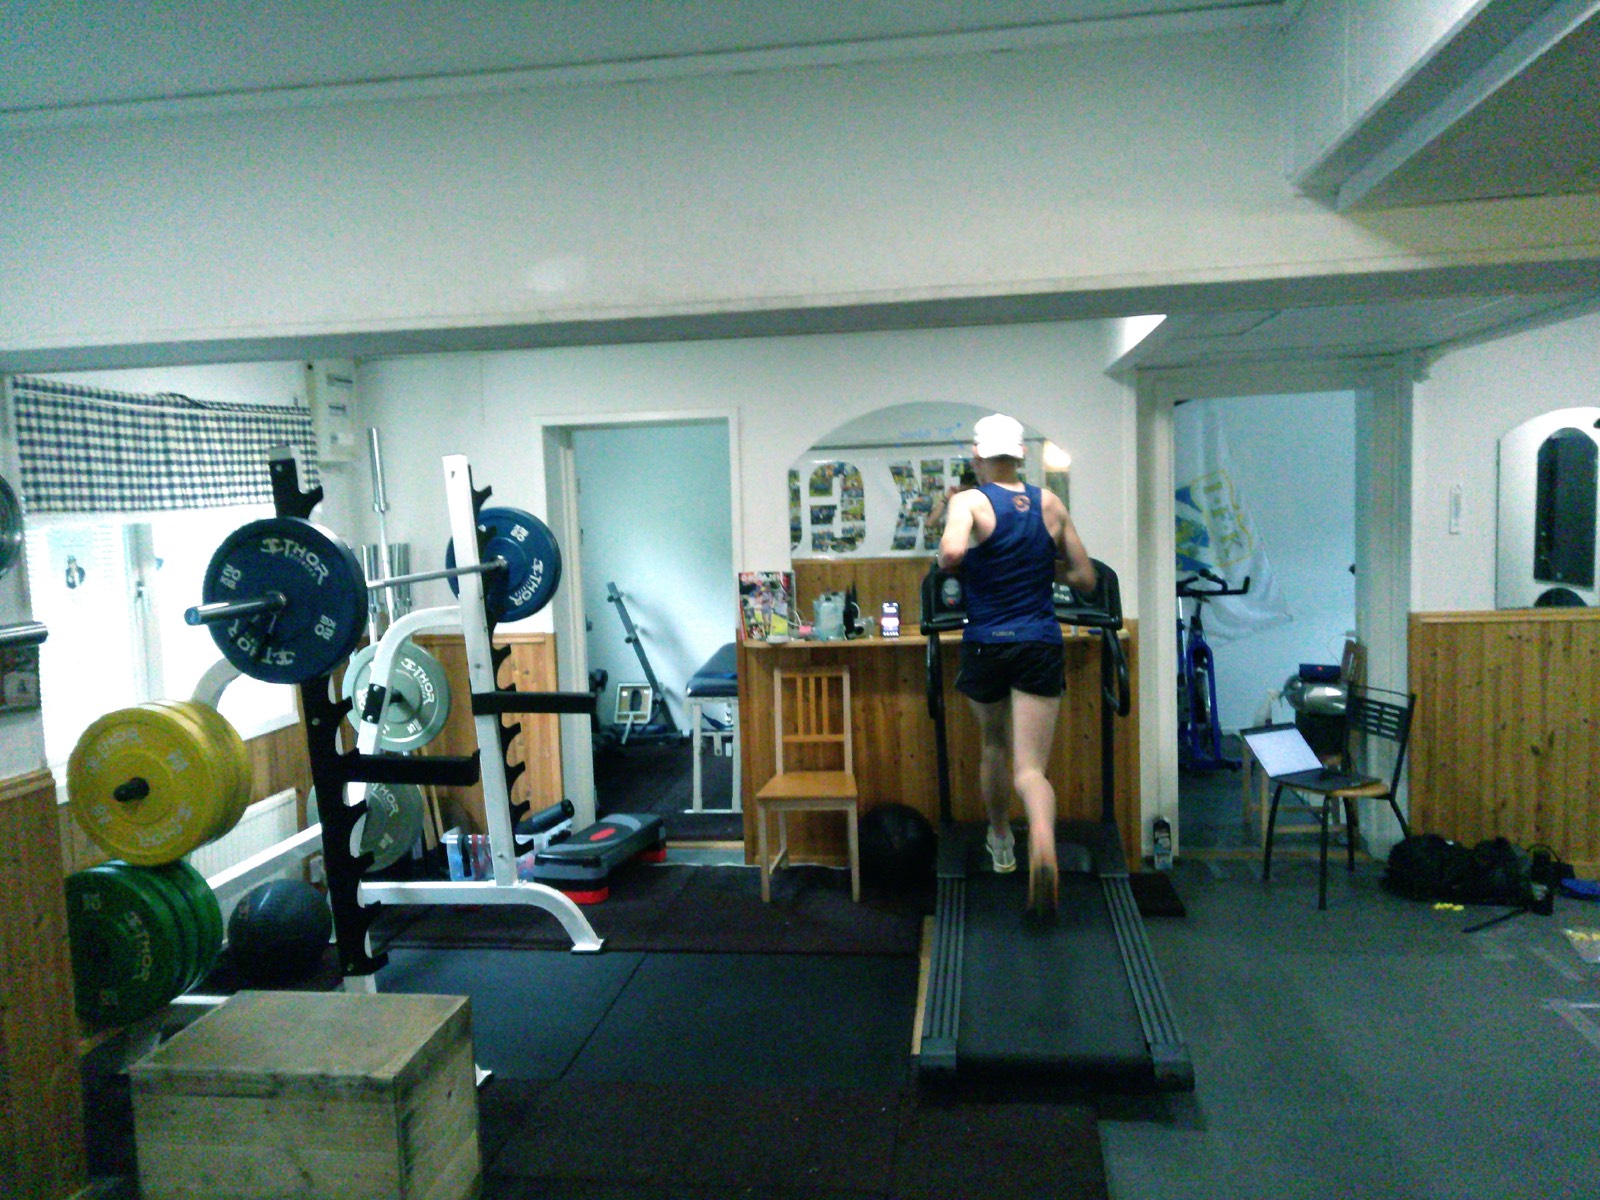
It's October, and so far 15 tests have been completed successfully.
- Treadmill tests
- 14
- Forest tests
- 1
- Retests needed
- 0
Summary
Fourteen treadmill tests (C1) are complete, and the first forest test (C2) went well. So far no session has needed to be retested or redone, and the measurements have been of good quality across the board and have gone as planned.
A First Look at the Treadmill Data
To give a sense of what each test produces, below is one anonymised treadmill test. Lactate stays low and fairly flat through the first three stages, then rises sharply over the last two — the classic shape the study relies on to locate the threshold. A simple linear interpolation between the last two stages puts this athlete's speed at 4 mmol/L at roughly 17.7 km/h. The final analysis will use the polynomial curve fit described in the proposal, so this number is illustrative only.
The speeds shown are the adjusted values from the treadmill calibration described in the previous update. In this test they differ from the displayed speed by up to 0.3 km/h, which is exactly the kind of gap that would otherwise blur comparisons between the two treadmills.
Athlete A — Treadmill lactate curve
Heart rate
Perceived exertion
Show treadmill data
| Stage | Displayed (km/h) | Adjusted (km/h) | Lactate (mmol/L) | HR (BPM) | RPE |
|---|---|---|---|---|---|
| 1 | 13.0 | 13.23 | 0.8 | 147 | 9 |
| 2 | 15.0 | 15.10 | 1.3 | 157 | 13 |
| 3 | 16.5 | 16.46 | 1.4 | 173 | 16 |
| 4 | 17.5 | 17.34 | 2.7 | 178 | 18 |
| 5 | 18.5 | 18.21 | 5.6 | 187 | 19 |
Lactate, heart rate, and RPE recorded at the end of each stage. Adjusted speed is the displayed speed corrected using the treadmill calibration.
Challenges from the Forest Test
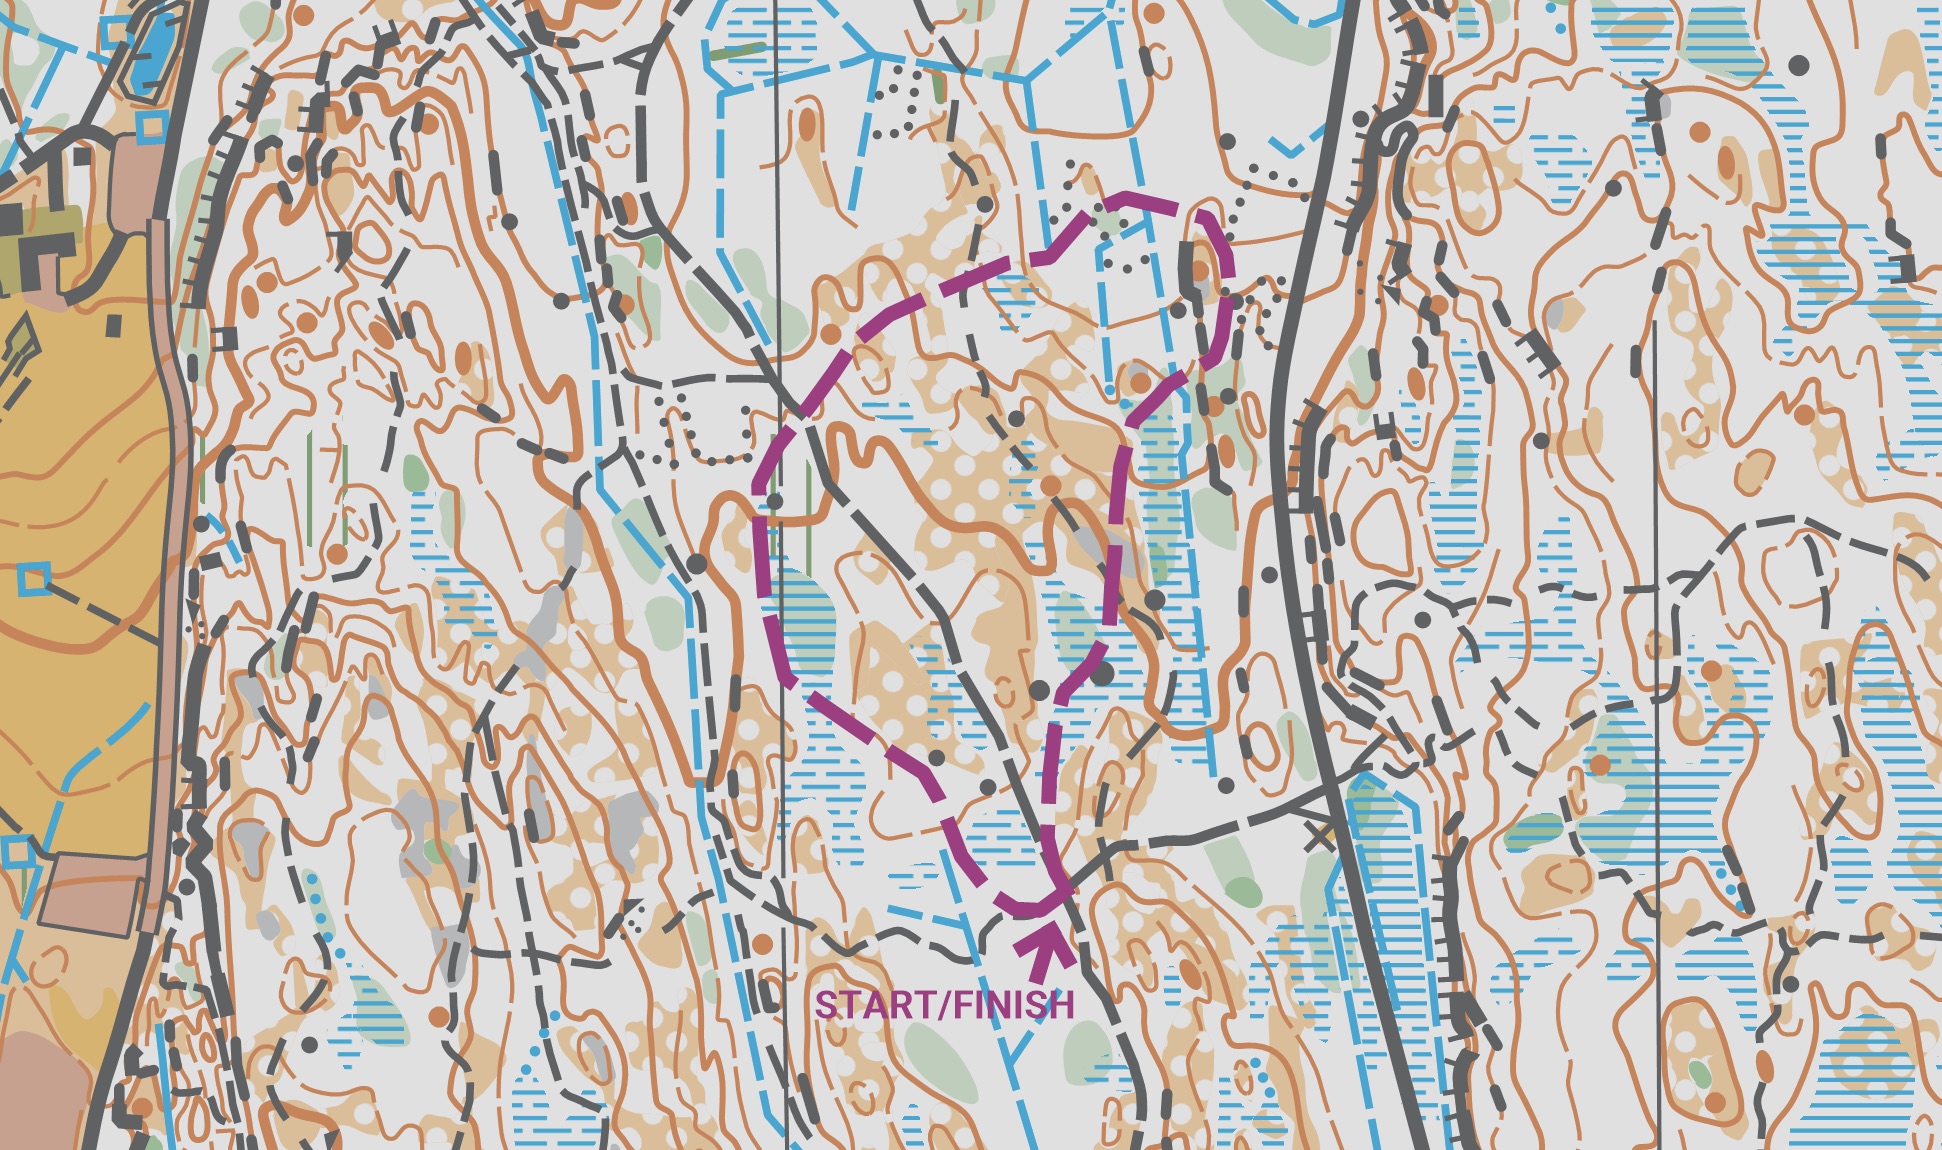
The forest condition has proven to be the harder of the two to standardise. On a treadmill, interval duration is fixed and speed is the variable. In the forest the loop itself is fixed, so the time each runner takes to complete it varies widely with ability. To keep intervals close to the intended ~5 minutes, I have to estimate, for each athlete, how much running distance they would cover in roughly that time.
In practice, this means running different versions of the loop in the first interval (the slowest) and in the last interval, so that interval times stay roughly equivalent. The first forest test shows what this looks like. Reps 1–3 were made up of two short sections and one long section, while reps 4–5 swapped one short section for a second long one. To compare the reps on equal terms, each is adjusted down to a single loop.
Athlete B — What each forest rep was made of
- Short section (240 m)
- Long section (445 m)
Athlete B — Forest lactate by rep
Show forest data
| Rep | Short / Long | Time | Adj. time | Distance (m) | GPS (m) | Adj. GPS (m) | Pace | Adj. pace | Lactate | RPE | HR |
|---|---|---|---|---|---|---|---|---|---|---|---|
| 1 | 2 / 1 | 5:35 | 4:15 | 925 | 943 | 702 | 6:02 | 6:12 | 0.8 | 12 | 137 |
| 2 | 2 / 1 | 5:12 | 3:45 | 925 | 958 | 712 | 5:37 | 5:28 | 1.3 | 15 | 152 |
| 3 | 2 / 1 | 4:25 | 3:21 | 925 | 948 | 704 | 4:46 | 4:53 | 3.3 | 16.5 | 166 |
| 4 | 1 / 2 | 5:42 | 3:24 | 1,130 | 1,169 | 708 | 5:02 | 4:57 | 4.1 | 18 | 171 |
| 5 | 1 / 2 | 5:20 | 3:14 | 1,130 | 1,157 | 702 | 4:43 | 4:43 | 7.1 | 19.5 | 174 |
Loop distance is 685 m (short section 240 m, long section 445 m). For reps longer than one full loop, the time is adjusted down to a single loop by averaging the times of the duplicated section, and the GPS distances of the short and long sections are averaged then added together. Adjusted pace is the adjusted time divided by the loop distance. Pace in min/km; lactate in mmol/L; RPE on the Borg 6–20 scale; HR in BPM.
That solves the timing problem but introduces another one. Because the loop is not uniform, some runners end up spending proportionally more of an interval in the tougher sections of the terrain than others. In this test, rep 4 — the first rep with the extra long section — was slightly slower than rep 3 on adjusted pace (4:57 vs 4:53 min/km), yet lactate, heart rate, and RPE all rose. From one test it is impossible to say how much of that is the change in terrain and how much is simply fatigue building across reps, and that ambiguity is a potential source of bias, since terrain cost is exactly what the secondary research question sets out to measure.
There are two options I am currently weighing:
- Fixed loop sets. Use a fixed set of loop versions for men and a slightly shorter fixed set for women, so that every athlete within a group covers the same terrain.
- Adjust in analysis. Keep tailoring the loop to the athlete and account for the differences in terrain afterwards, when comparing C1 and C2.
Thank You
I am grateful for how many people have stepped up for these tests am thankful to every participant who has been a part of the study so far. Keep an eye out for the next update!